
My love affair with GDB will never end, eh? I think this is the longest and most detailed GDB post yet (apart from my 3-part GDB tutorial). If you’ve ever wondered about the weird letters and numbers you see in debug output and want to learn more about how registers, machine code, memory and the GDB disassemble command work, read on.
This is a long one. You might want to get a cuppa first.
Okay, so the reason I want to talk about the disassemble command today is because it took me a while before I was really comfortable using it, yet it is such a powerful and revealing tool. I’m going to walk you through a very basic program with a strong focus on one thing – memory.
Being able to understand the way that your device (or computer) is using memory with a debugger is a really exciting thing to do! We’re going to start with a very simple program, and we’re going to understand it inside and out.
Part 1: Outputting Machine Instructions
Let’s compile the code that we’re going to use. You can copy and paste this, or type it into vim in about a minute:
#include "stdio.h int main() { printf("Hello World!\n"); return 0; }Compile this on the command line with:
gcc -g -Wall hello.c -o helloIf you list the contents of the directory you are in, you should have a ‘hello’ executable. Now, at the command prompt type:
objdump -d hello | grep -A15 '<main>'This line breaks down as follows:
- objdump is a unix command that displays information about an object file (i.e. your executable).
- -d means disassemble. It takes your object file and displays the machine instructions (in assembler) for your program.
- hello is our executable – the argument passed to objdump.
- Next we pipe – | – the output into grep, which is a unix command for searching text.
- We tell grep to only display 15 lines after it matches the pattern ‘main’. -A15 means show 15 lines after main. You could also use B15 (15 lines before main) or -C15 (15 lines either side of main for context).
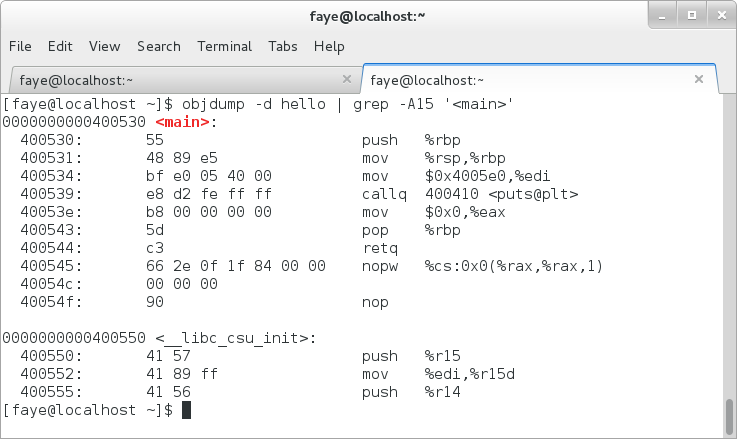
All this essentially boils down to printing out the machine instructions for the ‘main’ function of our program. Your output (assuming 64-bit) should look something like this:
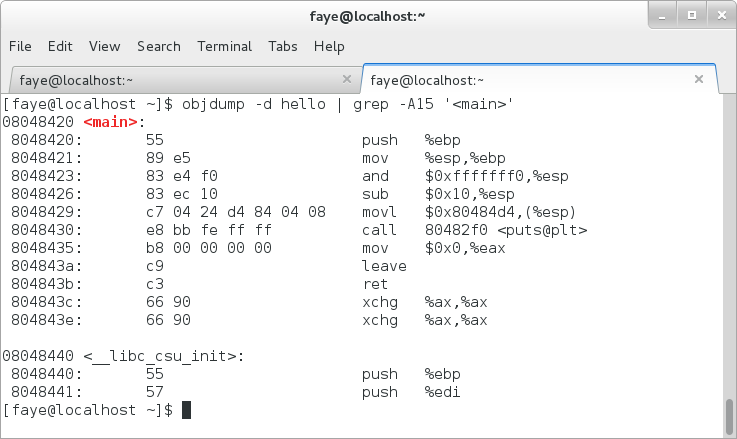
Or, if you are working on a 32-bit platform, more like this:
If you’re looking at this and saying,
Yeah and?
Hang in there. All will be revealed.
OK, so this output is essentially the list of machine instructions (written as assembler) for the main function of our hello program. This is the step-by-step account of what actually happens when you run hello on your device. Let’s say that again, just to stress the point. This is what happens on your device at a cellular level when you run hello. You can’t really get any lower than this – it’s the bottom of the programming stack, so to speak. The basis for everything. The heart of your program. At this point, you are talking the same language as the machine.
Amazing, eh?
Alright, so now a word about assembler. The words you see in the output (push, mov, add) are mnemonics for the machine instructions. They are there so we know what machine instruction is being called. There are two main ‘flavours’ of these assembler mnemonics: Intel and AT&T. The default (on my linux box) is AT&T. The biggest difference between Intel and AT&T is: Intel: destination comes before source AT&T: source comes before destination.
To illustrate what I’m on about, take this line from the screenshot above:
mov $0x0, %eaxThis is AT&T. Registers are prefixed with %; intermediate values are prefixed with $; and the destination (the eax register) is listed second. The equivalent with Intel would look like this:
mov eax,0x0This is Intel. No prefixes. And the destination (the eax register) is listed first. It is really personal preference which one you find more logical (and readable).
I prefer AT&T, but if you want to use Intel, add the -Mintel flag to the objdump command so it looks like this:
objdump -d -Mintel hello | grep -A12 '<main>';We’ve got our machine instructions, now let’s use GDB to see them working.
Part 2: Debugging With GDB
Start debugging your hello executable in GDB with:
gdb helloThen, in GDB set a breakpoint at the top of the main function:
b mainAnd run the program:
rIt will now stop at the top of the main function. Use the disassemble command:
disassembleAnd you’ll get output that looks something like this:
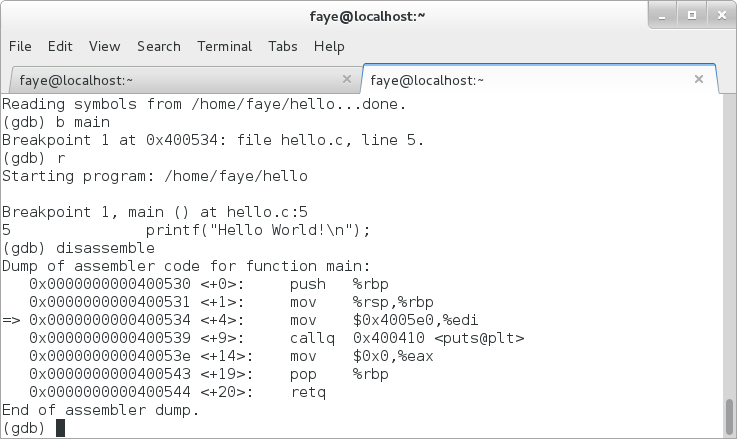
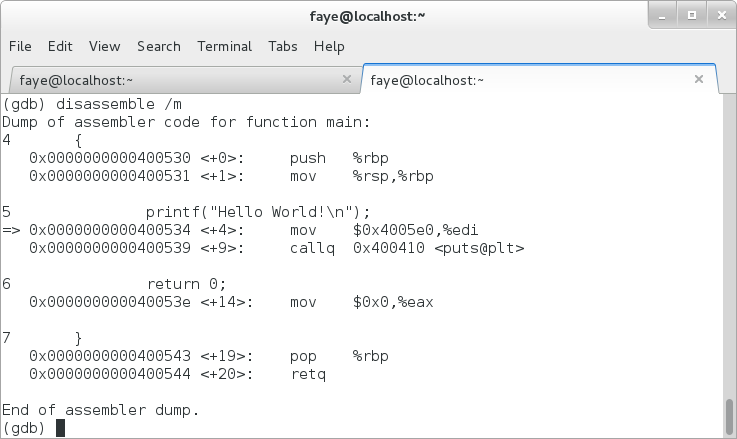
Does it look familiar? That’s right – it’s the same as the output that objdump gave you – the machine instructions for the main function. To make it more readable, there is a handy /m argument you can pass to disassemble:
disassemble /m Which interleaves the source code among the machine instructions (how cool is that?!).
This is great for breaking down what you are looking at and helping you to find your bearings:
Part 3 – Viewing Memory
So far, we’ve printed out the machine code, and matched it up with a live GDB session that shows the same code to us. What we’re going to look at now is the memory that’s being used, and how.
To the right of the assembler mnemonics (i.e. push, mov, …), there are various numbers and letters – these are the values that the machine code is manipulating. Many of these (those prefixed with % in AT&T syntax) will be CPU registers.
What the hell is a register anyway?
A register (or a processor register, to be more precise) is a fast-access storage area on the CPU (i.e. the actual processor chip).
So, when you look at register values, you are reading the actual values direct from the CPU (isn’t that exciting!).
EVERYTHING goes through these registers. They are the essential foundation for how your computer does what it does. Information is loaded in, manipulated or tested in some way and then sent back out. It is the heartbeat of your computer’s existence.
Being able to understand the registers is a critical (and oft neglected) programming and debugging skill.
Who runs the show?
The information that goes into and out of your registers is dictated by the compiler that you used to create your program.
Alternatively, if you can program in assembly language, you can dictate the sequence of information flow yourself.
Register naming
Registers have set names, but they vary according to platform architecture. The easiest way to understand the difference is to look at the primary accumulator register (rax) and how it is denoted on different systems. The pattern is similar for other register names.
64bit – RAX (RAX the whole 64 bit register)
32bit – EAX (extended AX – the whole 32 bit register)
AX – the original 16 bit accumulator register, made up of:
AL – bits 0-7 (accumulator low)
AH – bits 8-15 (accumulator high)
Note that RAX and EAX still contain AX (and RAX still contains EAX).
In the screenshot above, even though I am working on a 64 bit platform, there is a reference to the %eax register. This just means that the value is being put into or read from the lower half of the 64bit %rax register.
OK, I get it. So which registers do I need to know about?
There are hundreds of registers, but the main registers (on a 64bit x86 system), that are usual for debugging are as follows:
rsp – stack pointer
rbp – base pointer (frame pointer)
rip – instruction pointer
rdi – destination index
rsi – source index
rax – accumulator
bx – base
rcx – counter
rdx – data
Getting back to our code: notice the little => symbol on the left-hand side in the GDB output above?
That tells you exactly where the instruction pointer is. The instruction pointer is a register (%rip or %eip on 32 bit systems) that points to the current machine instruction. You can see at our breakpoint that it points to main+4 (the numbers in angle brackets in the gdb disassemble dump). So, our current location is (almost) the beginning of main.
The two lines above this are called the function prologue. The function prologue is the set up of the stack and registers for use in this function. So our function prologue is this line:
push %rbp move %rsp,%rbp
Which essentially tells the computer to do the following:
- Push the value of the base pointer (%rbp or %ebp) – also known as the frame pointer – onto the stack. We’ll use this later, when we exit the function.
- Set the base pointer to the value of the stack pointer. This gives us a new base pointer, ready for this function, at the top of the stack (where the new space is) ready for us.
- If you declare variables, you will also see a sub $0x10,%rsp command (the $ value will vary), which offsets (grows) the stack pointer by the space required for the declared variables in that function (remember that the stack grows down, not up). We don’t have any variables in our main function, so this part of the function prologue is missing.
- More complex functions may contain other set-up lines, but the essential thing to take away here is that the function prologue is completed before we do anything in the given function in a debugger.
The first instruction (after the prologue) is
mov $0x4005e0,%rdi
This moves the value at 0x4005e0 into the destination index register. More explicitly, we can see the value of 0x4005eo by using the GDB examine memory command ‘x’:
If we print out the decimal value (x/d) we get 72.
If we print out the char value (x/c) we get ‘H’ (H is decimal 72 in ASCII).
If we print out the memory as a string (x/s) we get “Hello World!”.
Bingo!
So we’re moving the Hello World! string to the %rdi register. The %rdi register (destination index) and %rsi register (source index) are two registers used for string operations. Once our string is in %rdi, we have
callq 0x400410,<puts@plt>
This is a great line.
callq (the GNU version of call) is the mnemonic for calling another function. The address 0x400410 – is the location of the function, and the angle brackets afterwards tell us what is being called. Interestingly, puts is the actual function that is listed here (not printf – the compiler has decided that since we are only outputting a string the overhead of the call to the more complex printf can be sacrificed!). And it is located via the procedure linkage table (@plt) – this is a list of entries for function calls that are dynamically linked to your executable.
Once we’ve called puts (which will use the string in %rdi and send it to stdout), we have:
mov 0x0,%eax
Which sets the accumulator register (%eax) to zero – the return value from a function is stored in the accumulator. Finally we have the function epilogue:
pop %rbp retq
The function epilogue does all the clearing up and resetting of pointers, before returning to the calling function. In this simple example it simply pops the base pointer off of the stack to return it to its original value and then call retq (GNU for ret), which is the command to return from the subroutine.
PHEW!!!
If you made it this far, well done! This is a LOT of information all in one place. Now that you’ve had a basic introduction to the GDB disassemble command and the relevant memory and registers, you can make a little bit more sense of the output of GDB and hopefully increase your bug-tracking skills.
If you love GDB and still want to know more, I have a collection of GDB How To’s that will keep you busy for a while.
Thank you for reading.

A little something I made
When I’m not writing about code, I design geeky mugs. If you’d like one for your desk, or know someone who would, take a look at my designs.
