
It wasn’t that long ago (well, okay, it was back in 2010, but anyway), that using the GDB debugger left you with the issue of how to maintain your breakpoints from one debug session to the next.
After carefully adding breakpoints, and spending time getting them in just the right place, it was a real headache to have to repeat that exercise the next time you ran a debug session – especially when you were dealing with one of those nefarious bugs that can take days to track down.
I used to list my breakpoints, copy and paste them to a file, then add them to the .gdbinit file for the next time I wanted to use them. Annoying.
Well, in case you’ve been doing the same, or if it never even occurred to you that you could preserve your perfectly positioned breakpoints between sessions, I thought I’d mention that since gdb 7.2 you’ve been able to save your breakpoints in one single step with the following command:
save breakpoints myfile.txt
Phew!
And when you want to use them again, just import them with:
source myfile.txt
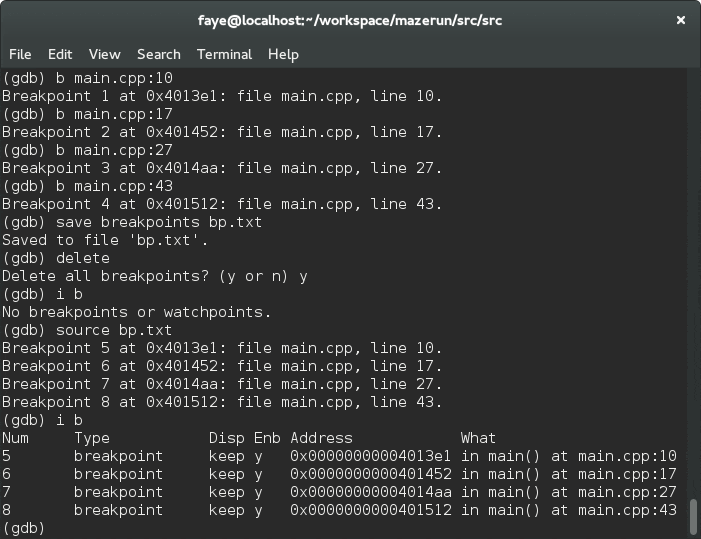
Here’s a quickie screenshot where I’ve added 4 breakpoints, saved them to a bp.txt file, deleted them, listed breakpoints to show none present, then re-added them and listed them to show them after import.
Great stuff 🙂

A little something I made
When I’m not writing about code, I design geeky mugs. If you’d like one for your desk, or know someone who would, take a look at my designs.
